Playbook · Reporting · 20 min
Compare creators after the campaign to pick the next shortlist
Anyone planning the next campaign with last campaign's numbers in a sheet.
With post metrics refreshed and spend per creator in the sheet, rank creators on three things: cost per engagement, reach versus their usual average reel views (over-delivery is the real signal), and revenue by code if you have it. Rebook the top third, drop the bottom third, and run lookalike profiles from the top two to fill the gap with similar accounts. Insight reports on the newcomers keep audience fit and price honest. Each campaign makes the next shortlist better.
You need
- A measured campaign in a sheet
- Profile metrics (average reel views) for each creator
Step by step in Zaver
- 1
Three scores per creator
Cost per engagement; views divided by average reel views; code revenue. Rank on each.
- 2
Decide thirds
Rebook the top third; keep the middle on watch; drop the bottom third with a reason noted.
- 3
Expand from the winners
Tools → Lookalike profiles from the top two creators, one hop, same size band.
- 4
Vet the newcomers
Insight reports on the ten best lookalikes: audience fit, authenticity, fair price.
- 5
Lock the new shortlist
Rebooked creators plus vetted lookalikes become the Scouting tab for next time.
Or ask it in ChatGPT or Claude
With Zaver connected as an MCP server, the whole job is one message. Your assistant calls run_data_tool behind the scenes.
rank the creators in my Deliverables tab by cost per engagement and by views versus their average reel views, then find lookalikes of the top twoNot connected yet? Set it up in about a minute.
Where it is in Google Sheets
The menu path, step by step. Labels match the Zaver.one add-on.
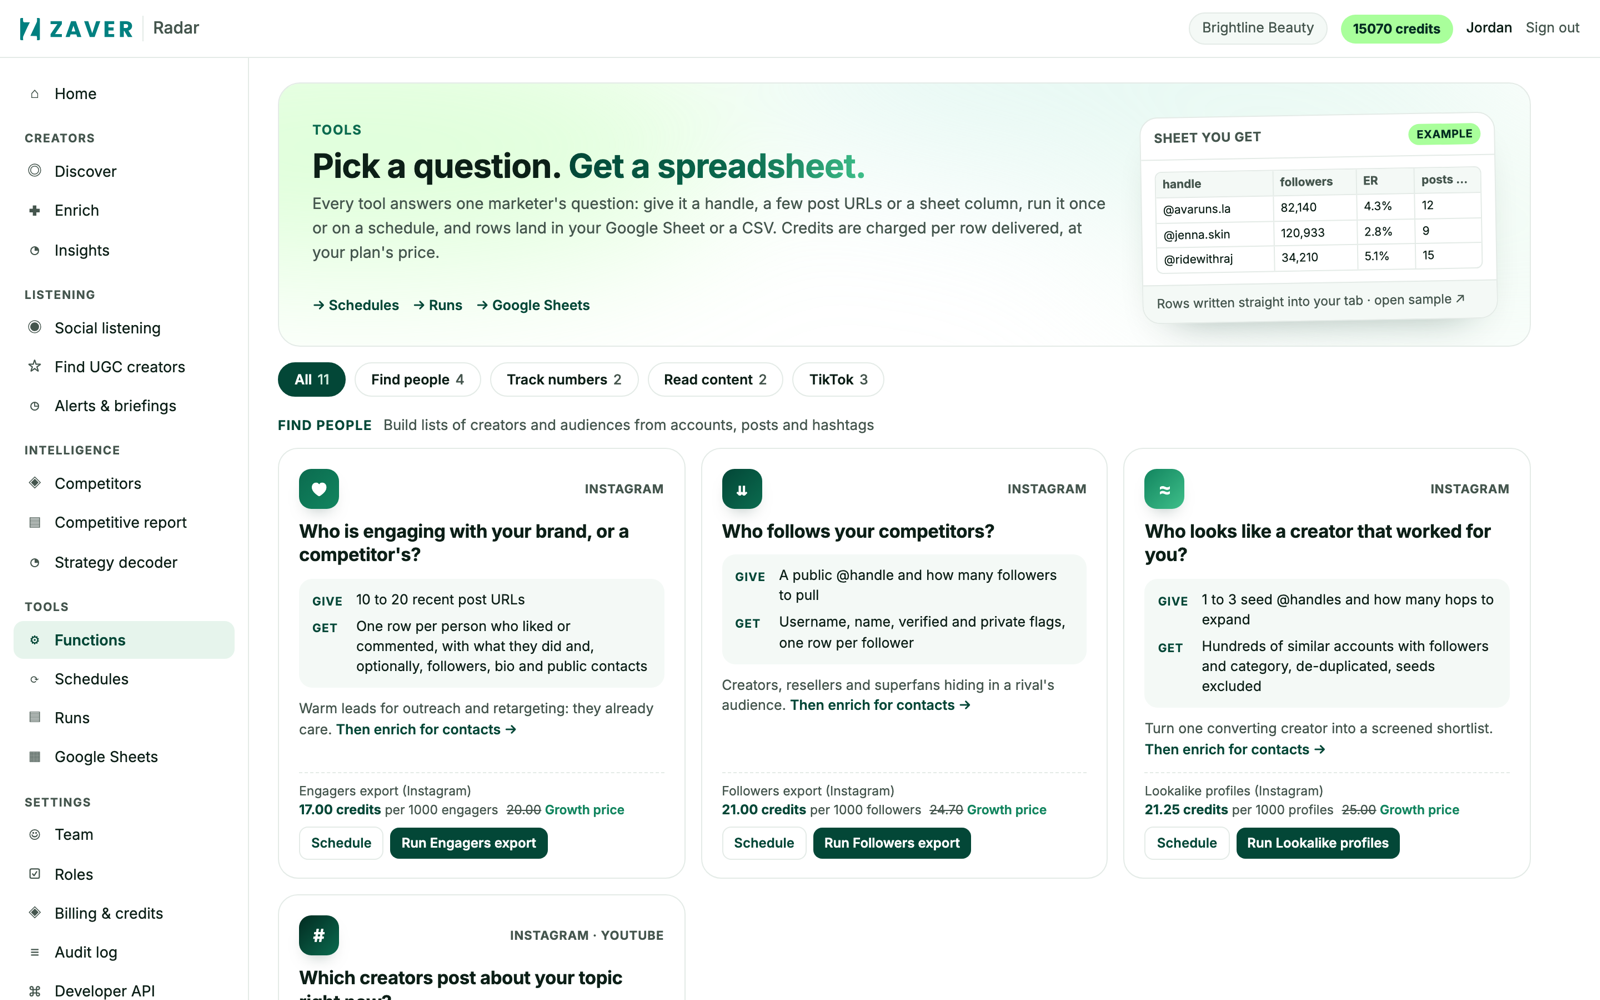
1 Radar → Tools: run once or on a schedule; results land in a connected Google Sheet or a CSV. 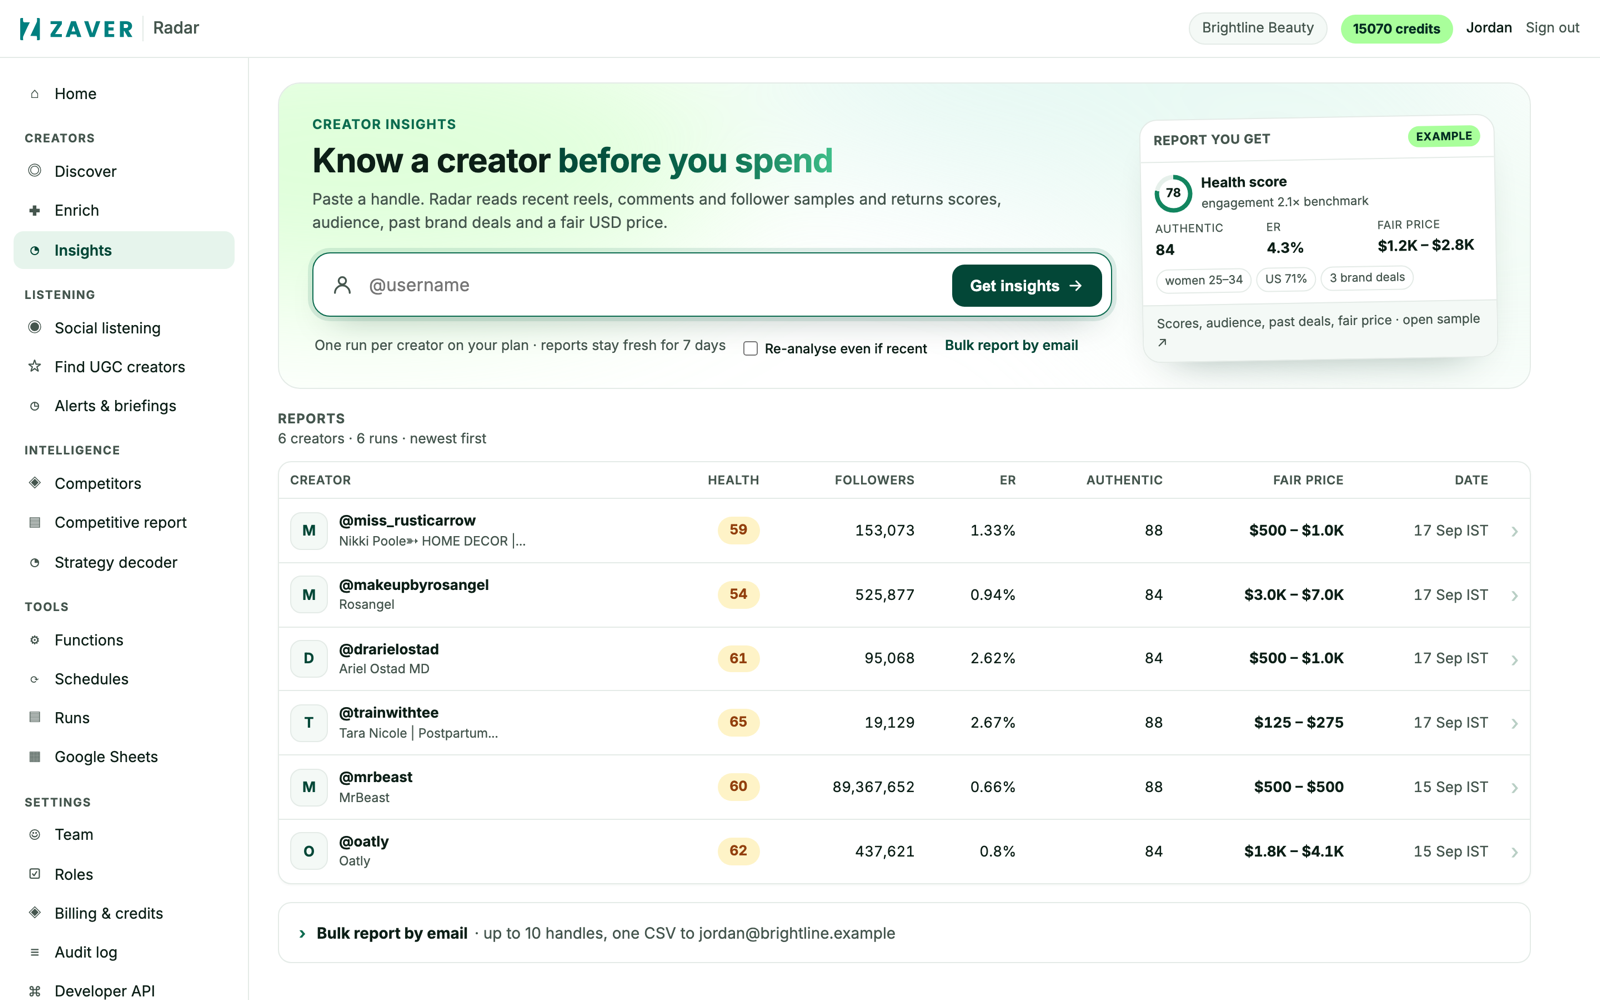
2 Radar → Insights: one row per report with health, engagement rate, authenticity and the fair price.
What you get
Input: 12 creators · Q3 campaign
| Creator | Cost / eng. | Reach vs usual | Code sales | Decision |
|---|---|---|---|---|
| @sk***by.m | $0.08 | 2.0× | $410 | rebook · seed lookalikes |
| @glow***na | $0.10 | 1.3× | $2,140 | rebook |
| @big***fit | $0.41 | 0.6× | $0 | drop |
Illustrative sample. Handles are masked; numbers show the shape of a real result, not a specific account.
Limits
- Reach versus usual needs a profile refresh for average reel views
- Revenue attribution today uses your own promo codes or UTM links per creator, pasted into the sheet. A Shopify integration for revenue attribution is coming soon; nothing on this page depends on it.
Questions
Why reach versus usual rather than raw views?
A 20K creator who doubles her usual reach for you is a better partner than a 400K creator who halves his. Raw views reward size; the ratio rewards fit.
Related playbooks
Measure an influencer campaign without a platformFind more creators like your best performersKeep a creator roster alive with no manual workLookalike creatorsAll playbooks